Matplotlib (4.8.1)
Matplotlib is not my first time to see.
colors = 'rgbcmyk'      #red, green, blue, cyan, magneta, yellow, black
def bar_chart(categories, words, counts):
        "Plot a bar chart showing counts for each word by category"
        import pylab
        ind = pylab.arange(len(words))
        width = 1 / (len(categories) + 1)
        bar_groups = []
        for c in range(len(categories)):
                bars = pylab.bar(ind+c*width, counts[categories[c]], width, color=colors[c % len(colors)])
                bar_groups.append(bars)
        pylab.xticks(ind+width, words)
        pylab.legend([b[0] for b in bar_groups], categories, loc='upper left')
        pylab.ylabel('Frequentcy')
        pylab.title('Frequencey of six Modal Verbs by Genre')
        pylab.show()
>>> from bar_chart import *
>>> bar_chart(genres, modals, counts)
>>> genres = ['news', 'religion', 'hobbies', 'government', 'adventure']
>>> modals = ['can', 'could', 'may', 'might', 'must', 'will']
>>> cfdist = nltk.ConditionalFreqDist(
...     (genre, word)
...     for genre in genres
...     for word in nltk.corpus.brown.words(categories=genre)
...     if word in modals)
>>> counts = {}
>>> for genre in genres:
...     counts[genre] = [cfdist[genre][word] for word in modals]
...
>>> bar_chart(genres, modals, counts)
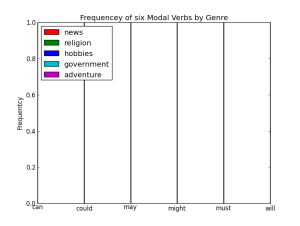
Nothing displayed....
Let's try to display with well-known way.
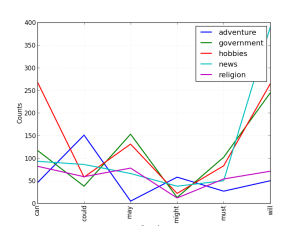
>>> cfdist.plot()
This means data itself should be fine. There should be some problems in the function bar_chart(). Do debugging.
>>> pdb.run("bar_chart(genres, modals, counts)")
> <string>(1)<module>()
(Pdb) s
--Call--
....
(Pdb) s
> /Users/ken/Documents/workspace/NLTK Learning/scripts/bar_chart.py(6)bar_chart()
-> width = 1 / (len(categories) + 1)
(Pdb) s
> /Users/ken/Documents/workspace/NLTK Learning/scripts/bar_chart.py(7)bar_chart()
-> bar_groups = []
(Pdb) s
> /Users/ken/Documents/workspace/NLTK Learning/scripts/bar_chart.py(8)bar_chart()
-> for c in range(len(categories)):
(Pdb) s
> /Users/ken/Documents/workspace/NLTK Learning/scripts/bar_chart.py(9)bar_chart()
-> bars = pylab.bar(ind+c*width, counts[categories[c]], width, color=colors[c % len(colors)])
(Pdb) p ind
array([0, 1, 2, 3, 4, 5])
(Pdb) p width
0
(Pdb) q
"p variable name" shows the value of the variables. Then I found width = 0. As this value is calculated like 1/n, the value should be less than 1 but 0 should be incorrect. Likely converted into integer.
Add one line at the beginning of the file.
from __future__ import division
colors = 'rgbcmyk'      #red, green, blue, cyan, magneta, yellow, black
def bar_chart(categories, words, counts):
        "Plot a bar chart showing counts for each word by category"
        import pylab
....
Try again.
>>> from bar_chart import *
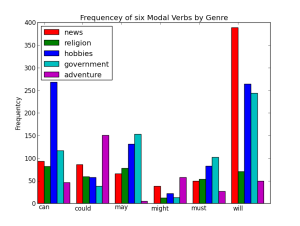
>>> bar_chart(genres, modals, counts)
Yes, displayed as expected!!


