plot() function error in matplotlib (Mac)
I got a following error when trying plot() function in NLTK.
>>> fdist.plot(cumulative=True)
Exception in Tkinter callback
Traceback (most recent call last):
 File "/Library/Frameworks/Python.framework/Versions/2.7/lib/python2.7/lib-tk/Tkinter.py", line 1470, in __call__
 return self.func(*args)
 File "/Library/Frameworks/Python.framework/Versions/2.7/lib/python2.7/site-packages/matplotlib/backends/backend_tkagg.py", line 276, in resize
 self.show()
 File "/Library/Frameworks/Python.framework/Versions/2.7/lib/python2.7/site-packages/matplotlib/backends/backend_tkagg.py", line 348, in draw
 FigureCanvasAgg.draw(self)
 File "/Library/Frameworks/Python.framework/Versions/2.7/lib/python2.7/site-packages/matplotlib/backends/backend_agg.py", line 440, in draw
 self.figure.draw(self.renderer)
 File "/Library/Frameworks/Python.framework/Versions/2.7/lib/python2.7/site-packages/matplotlib/artist.py", line 54, in draw_wrapper
 draw(artist, renderer, *args, **kwargs)
 File "/Library/Frameworks/Python.framework/Versions/2.7/lib/python2.7/site-packages/matplotlib/figure.py", line 1006, in draw
 func(*args)
 File "/Library/Frameworks/Python.framework/Versions/2.7/lib/python2.7/site-packages/matplotlib/artist.py", line 54, in draw_wrapper
 draw(artist, renderer, *args, **kwargs)
 File "/Library/Frameworks/Python.framework/Versions/2.7/lib/python2.7/site-packages/matplotlib/axes.py", line 2086, in draw
 a.draw(renderer)
 File "/Library/Frameworks/Python.framework/Versions/2.7/lib/python2.7/site-packages/matplotlib/artist.py", line 54, in draw_wrapper
 draw(artist, renderer, *args, **kwargs)
 File "/Library/Frameworks/Python.framework/Versions/2.7/lib/python2.7/site-packages/matplotlib/axis.py", line 1052, in draw
 renderer)
 File "/Library/Frameworks/Python.framework/Versions/2.7/lib/python2.7/site-packages/matplotlib/axis.py", line 1001, in _get_tick_bboxes
 extent = tick.label1.get_window_extent(renderer)
 File "/Library/Frameworks/Python.framework/Versions/2.7/lib/python2.7/site-packages/matplotlib/text.py", line 752, in get_window_extent
 bbox, info = self._get_layout(self._renderer)
 File "/Library/Frameworks/Python.framework/Versions/2.7/lib/python2.7/site-packages/matplotlib/text.py", line 313, in _get_layout
 ismath=ismath)
 File "/Library/Frameworks/Python.framework/Versions/2.7/lib/python2.7/site-packages/matplotlib/backends/backend_agg.py", line 205, in get_text_width_height_descent
 self.mathtext_parser.parse(s, self.dpi, prop)
 File "/Library/Frameworks/Python.framework/Versions/2.7/lib/python2.7/site-packages/matplotlib/mathtext.py", line 3010, in parse
 box = self._parser.parse(s, font_output, fontsize, dpi)
 File "/Library/Frameworks/Python.framework/Versions/2.7/lib/python2.7/site-packages/matplotlib/mathtext.py", line 2344, in parse
 str(err)]))
ValueError:
$$
^
Expected end of text (at char 0), (line:1, col:1)
At beginning I thought there might still be some problems in matplotlib. However it was sample data specific issue. I changed the sample and restrict to Top50 like following.
>>> fdist = FreqDist(text1)
>>> fdist.plot(50, cumulative=True)
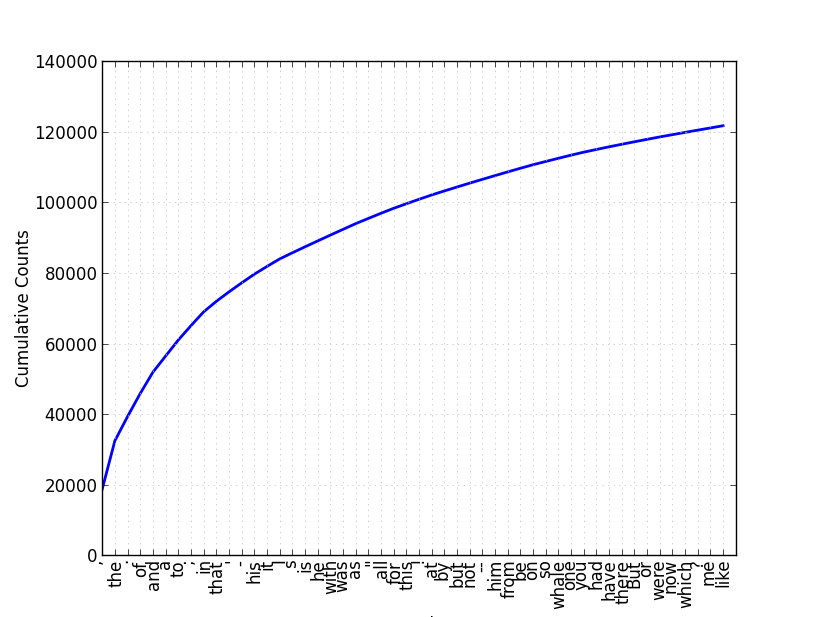
Now I can go ahead!